Document details
7
1
T. Flohrer, F. Schmitz

Abstract
A debris cloud from a fragmentation on orbit is modeled by transformation of variables from the instantaneous velocity distribution at the fragmentation time to the spatial distribution at some elapsed time later. We call this the Eulerian view of orbit dynamics, in contrast to the traditional ephemeris of individual particles, or Lagrangian view, borrowing terminology from the field of fluid dynamics. The initial distribution in velocity can be of any form; for example, the initial velocity plus a change equal in all directions and following the NASA EVOLVE 4.0 breakup model in magnitude. The spatial density map computed is derived from the solution of the Lambert (two-point boundary value) problem and the state transition matrix for unperturbed propagation. The transformation from the initial velocity density to final spatial density is therefore quite nonlinear, so the traditional tools of analysis that approximate assuming linearity or a Gaussian distribution fail dramatically. The transformation of variables technique does not make any such assumptions, and unlike the Monte Carlo method, is not subject to sampling errors.
The most time-consuming part of the computation is obtaining what we call the "complete Lambert solution", that is, all possible trajectories between the two defined points in the specified time interval. It is a naturally parallel calculation; each calculation at a point in space is independent of the others. Moreover, because of the cylindrical symmetry in the two-body Lambert problem, solutions need be obtained in only one half-plane; a simple rotation of the velocity vector and look-up of density solves all points on the ring around the location vector of the fragmentation.
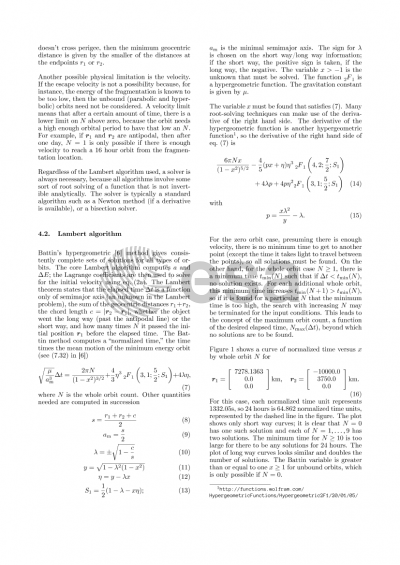
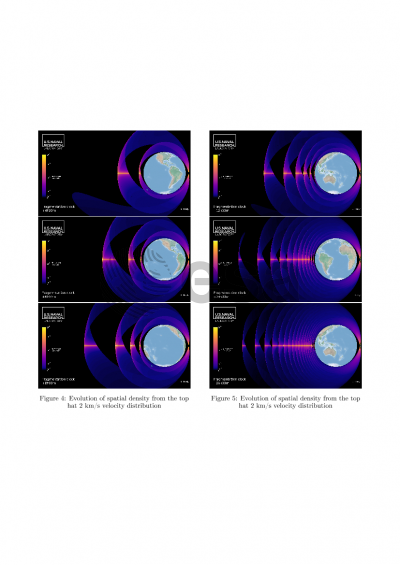
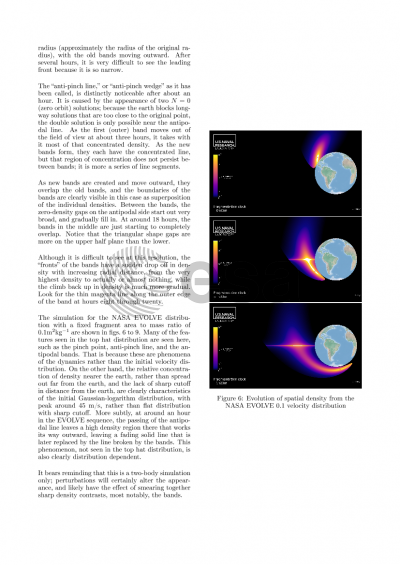
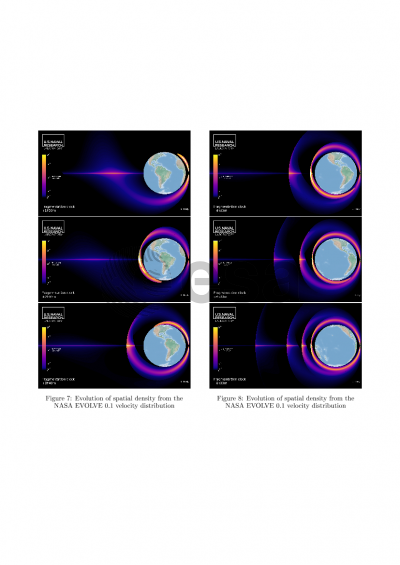
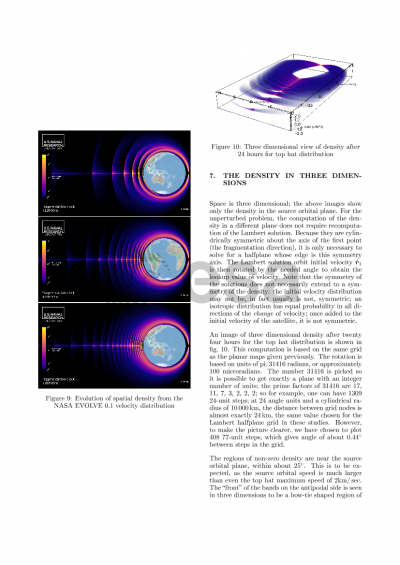
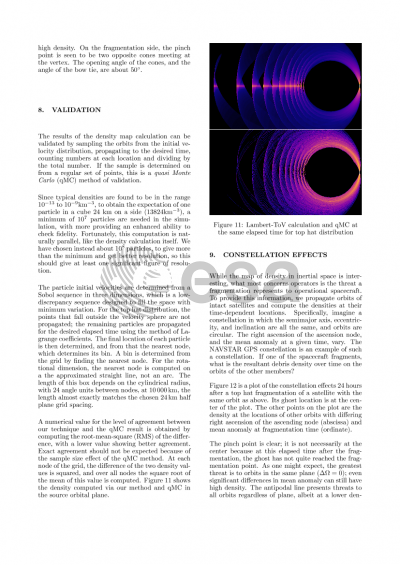
Structures and features are evident in the density maps, and these structures show promise for simplified approximation of the density map. The well-known pinch point at the fragmentation location in inertial space is clearly visible after an interval just a bit greater than an original orbital period. The anti-pinch line, or wedge, is also observed. Bands on the opposite side of the earth from the fragmentation are very noticeable, and their existence may be motivated from simple orbit dynamics. These bands make the anti-pinch line actually more of a set of anti-pinch line segments.
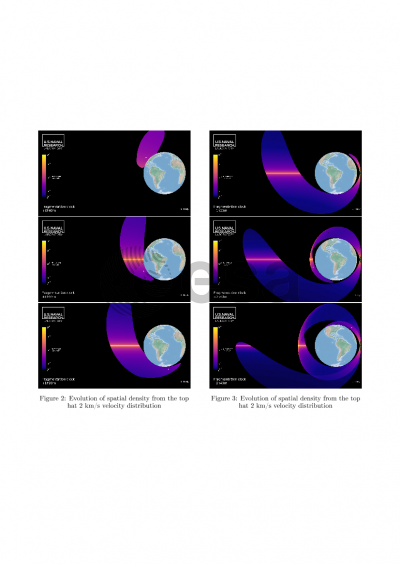
By computing these density maps over time and making a video, the global evolution is clear. There is a density generator, a wave of density emanating from very near the surface of the earth, with a leading front at roughly the same altitude as the pinch point. It cycles around the earth and creates the impression of a source of the bands, with newly created bands moving radially outward and diminishing in density. Although the initial velocity distribution affects the final spatial distribution, the Lambert solutions, which are the most time consuming to compute, need only be computed once. Therefore, different initial distributions may be changed and the results recomputed with relative speed.
Validation of this technique and its implementation is performed via Monte Carlo and quasi Monte Carlo simulation. Since typical densities are found to be in the range 10^{-13} to 10^{-9} km^{-3}, for expectation of one particle in a cube 24 km on a side (13824 km^{-3}), a minimum of 10^7 particles are needed in the simulation, with more providing an enhanced ability to check fidelity. Fortunately, this computation is naturally parallel, like the density calculation itself.
While an initial velocity change distribution such as that obtained from the NASA EVOLVE 4.0 breakup model with assumed isotropy shows the basic pattern and evolution of the spatial density provided by the dynamics, a more realistic anisotropy reveals important directional effects of the initial distribution. A simulated fly-through provides insight into the potential hazard experienced by an orbiting spacecraft and its dependence on the orbit and timing relative to the location and timing of the fragmentation.
Preview